Experiment 1
—
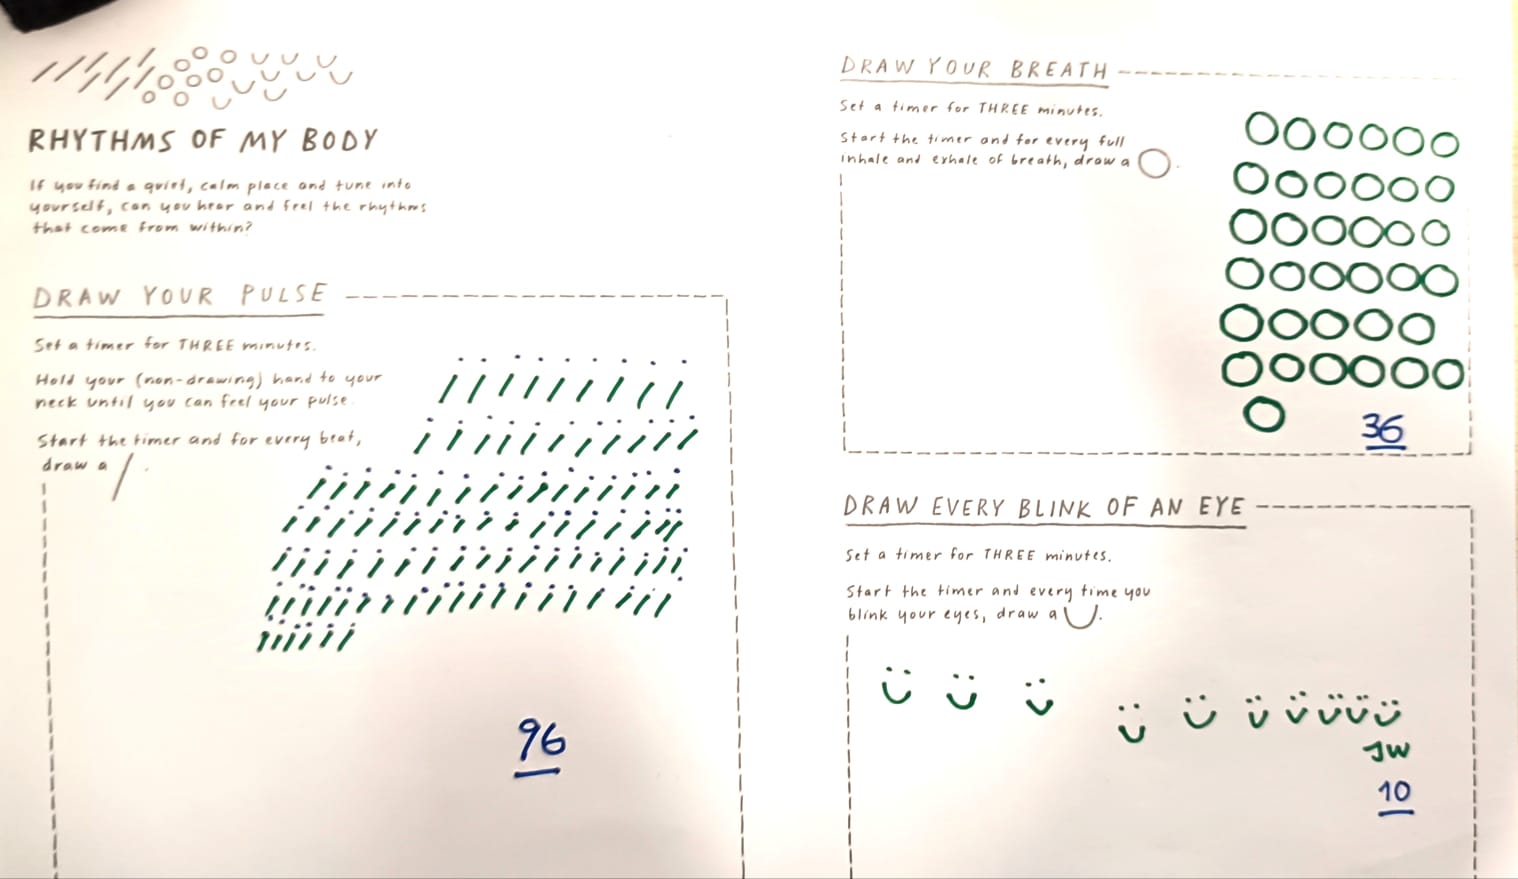
We Firstly jot down our individual data on paper
Using our team's data on pulse, blink, and breath, we employed p5.js to visualize this information through simple shapes. By manipulating rotation, color changes, size adjustments, and speed variations, we represented the data we collected.
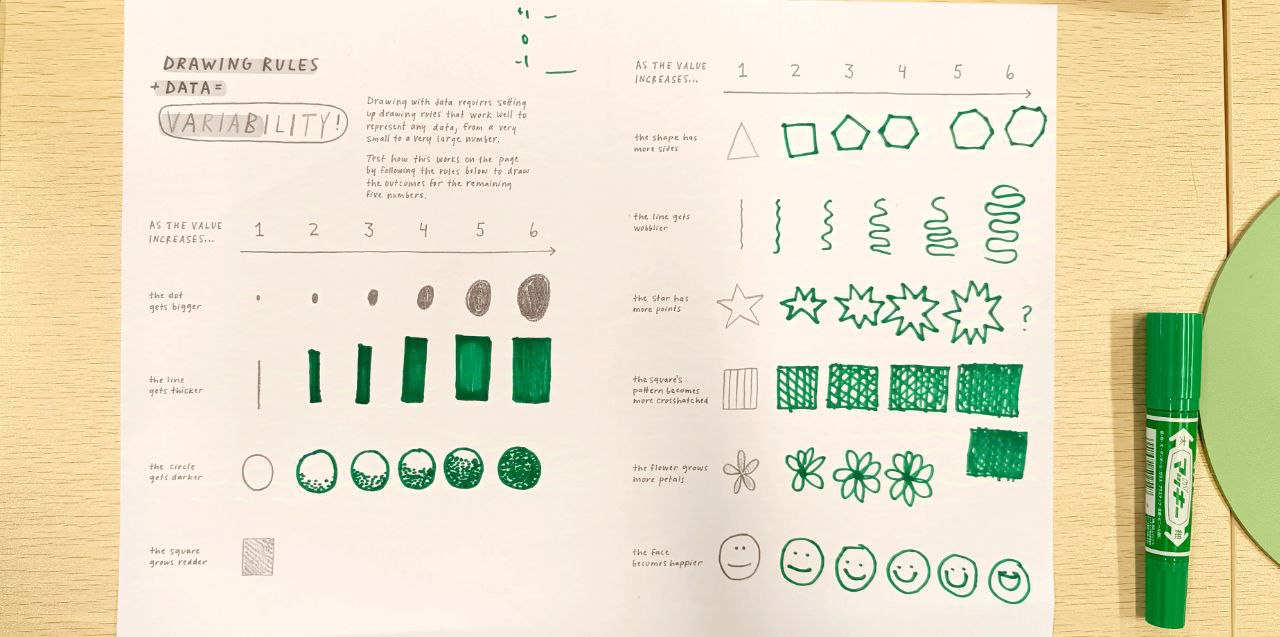
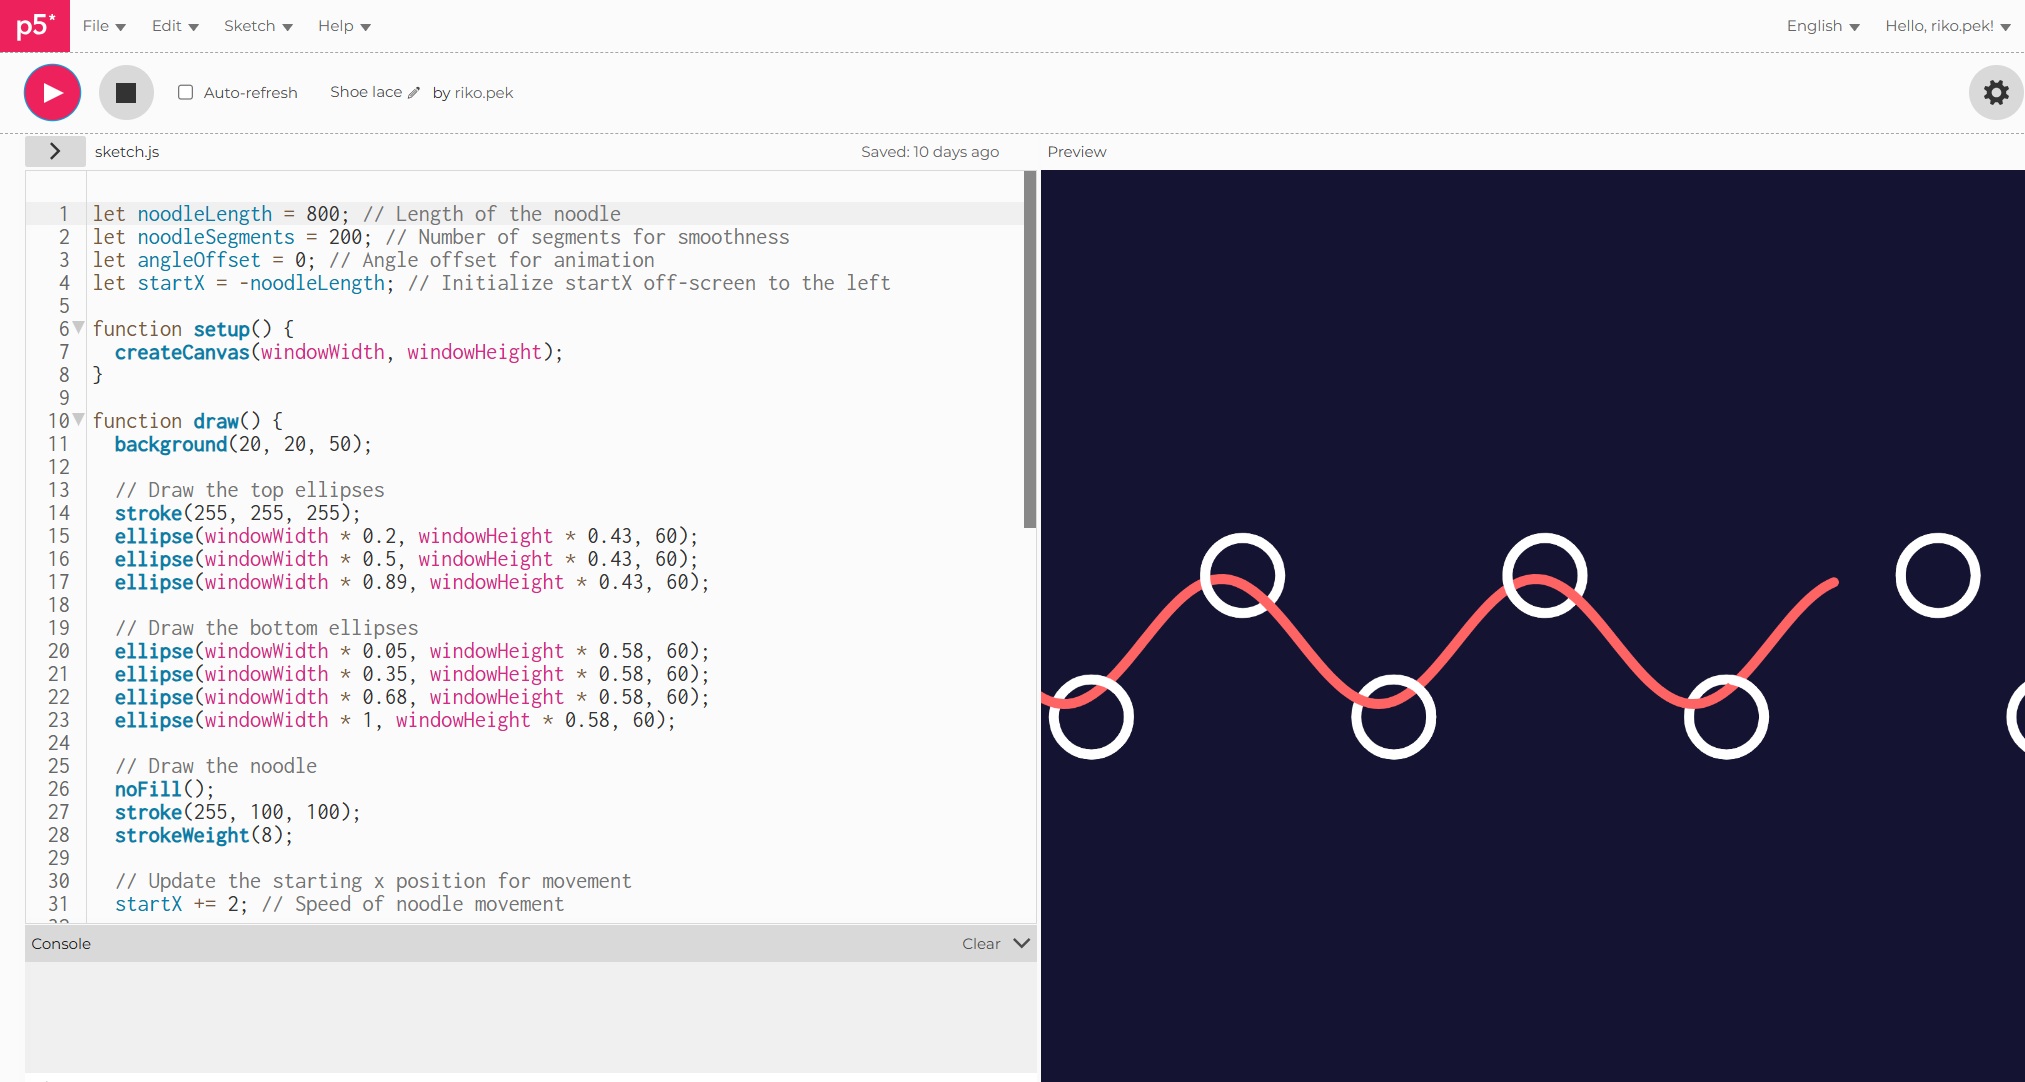
— Visualising how we can play with the shape in P5.Js
Some of our attempts:
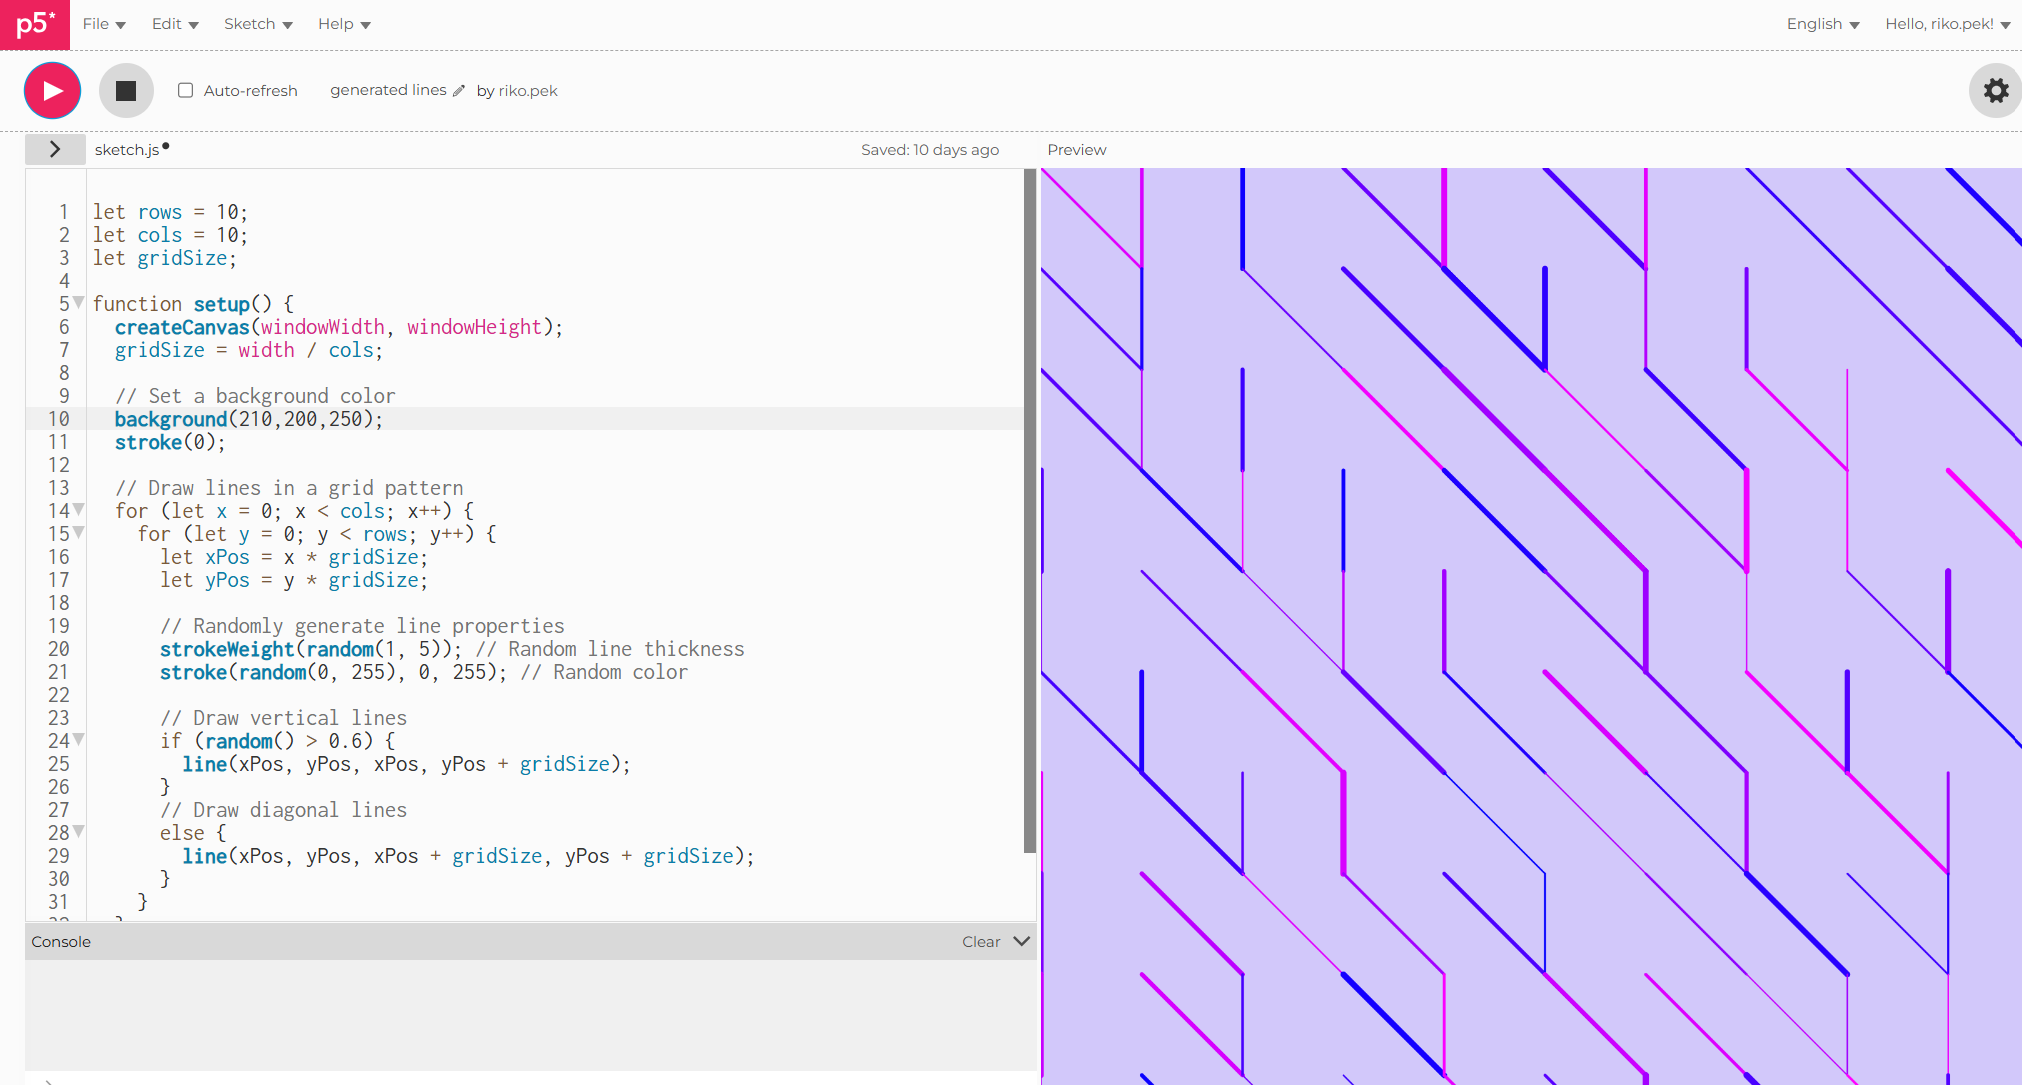
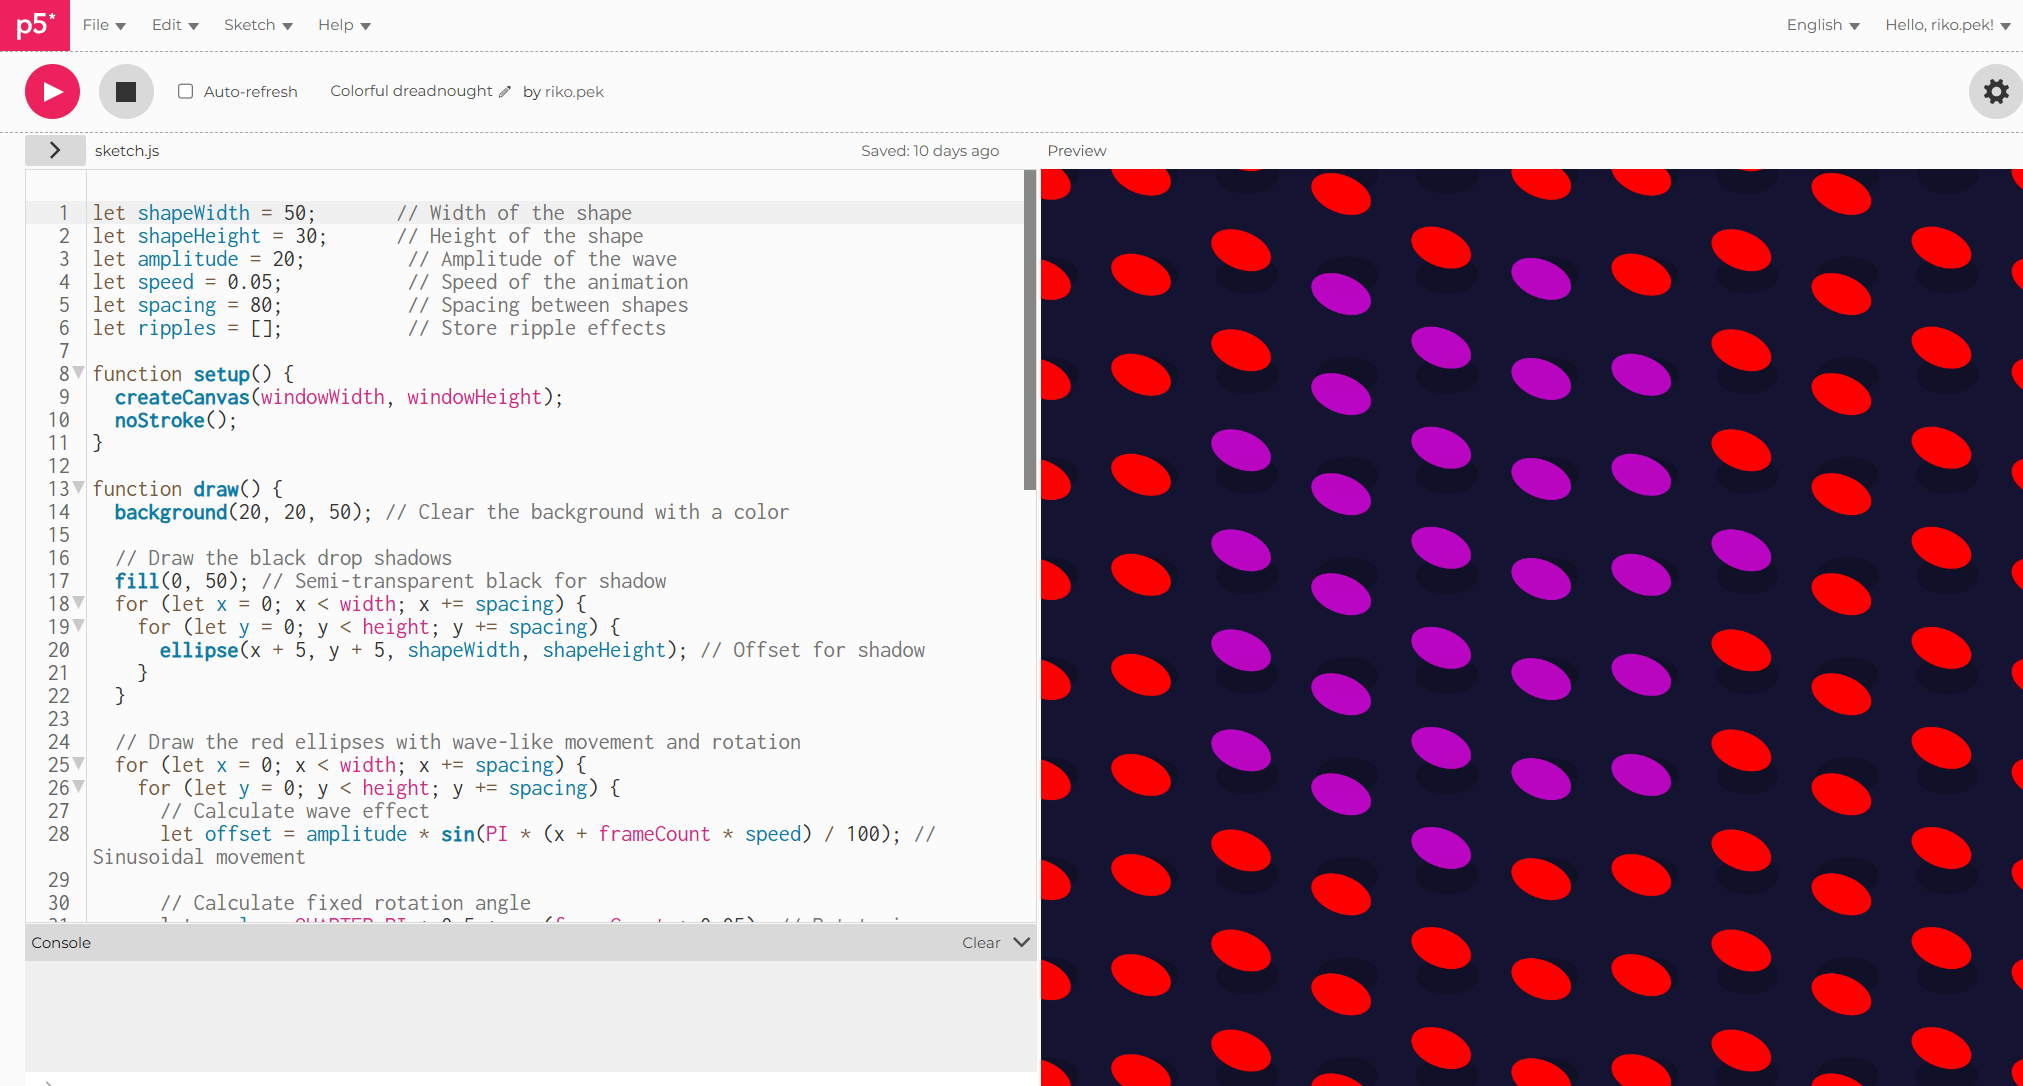
After practicing, we proceeded to something more coherant and advanced.
The Beginning
-
—
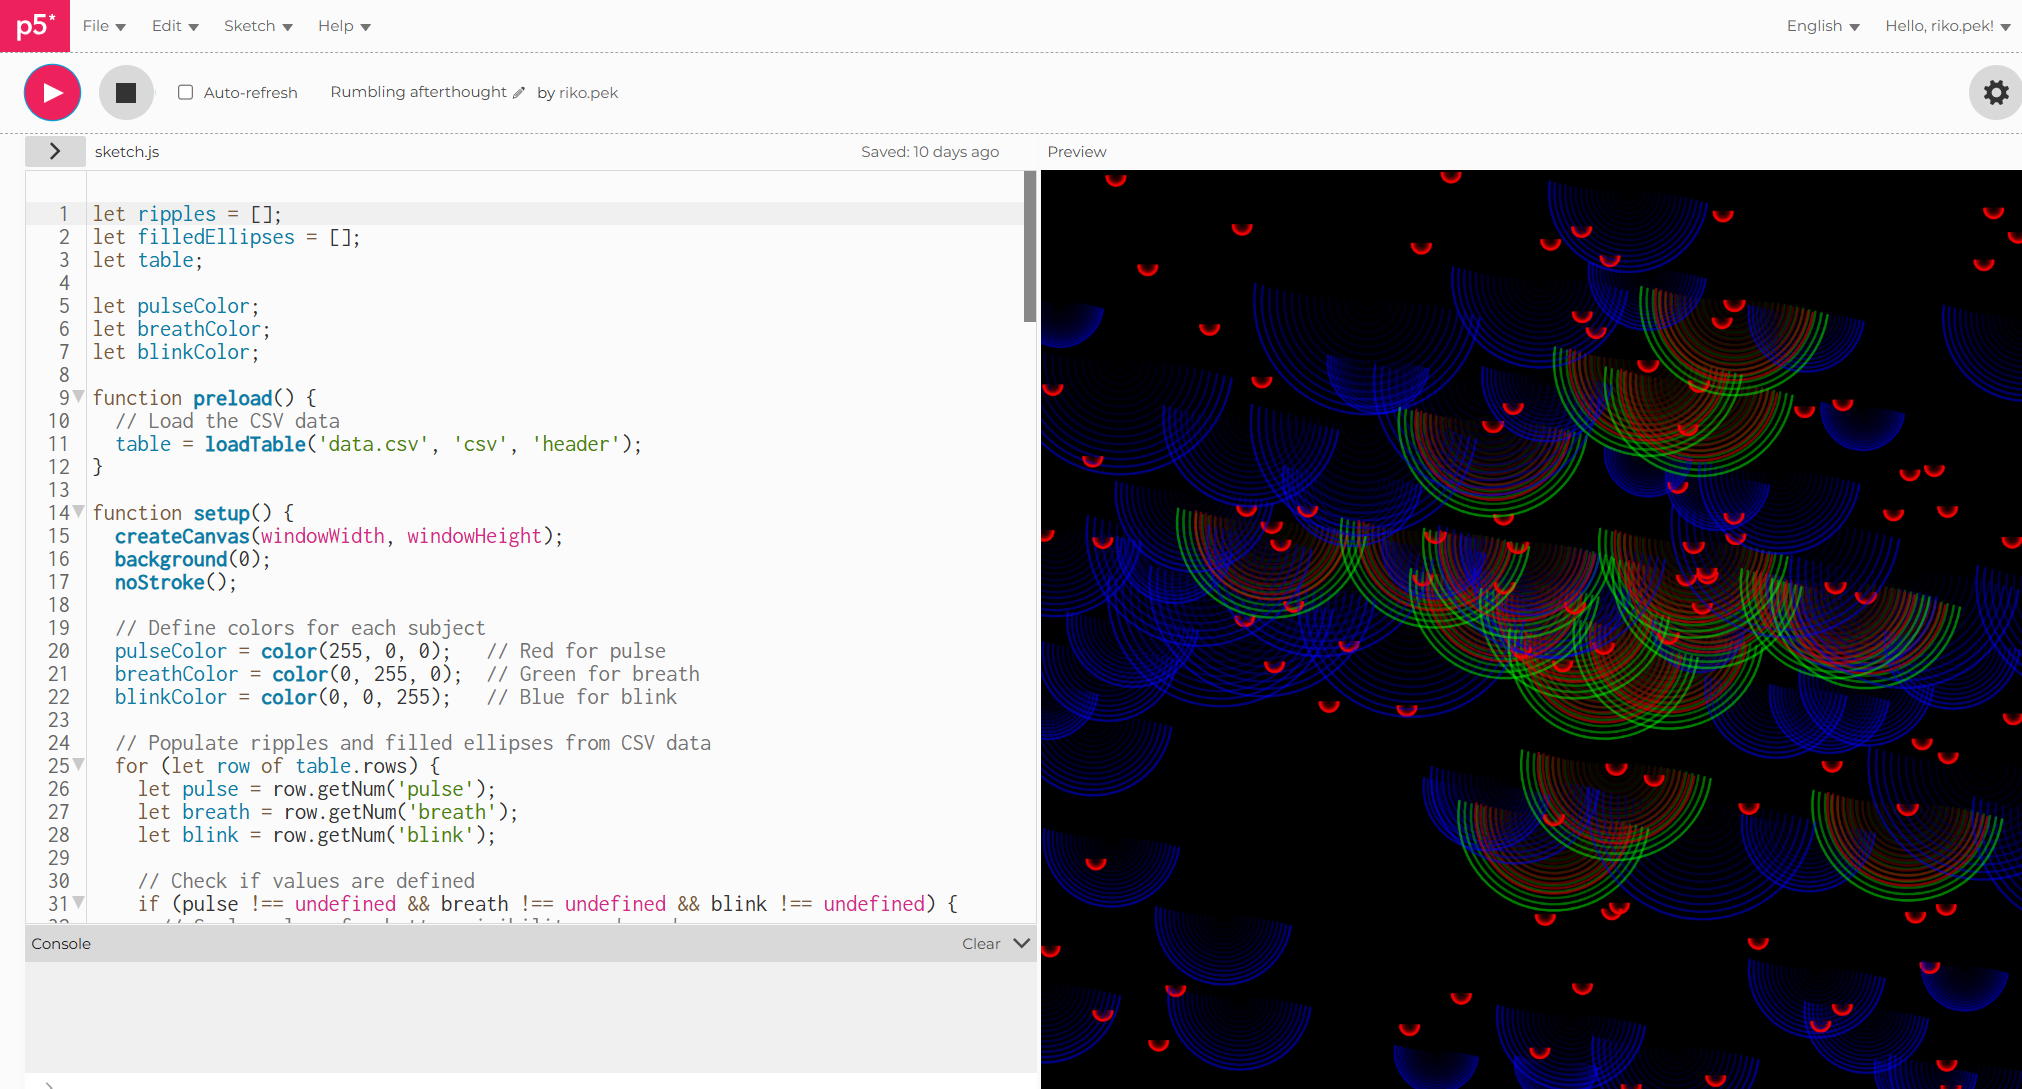
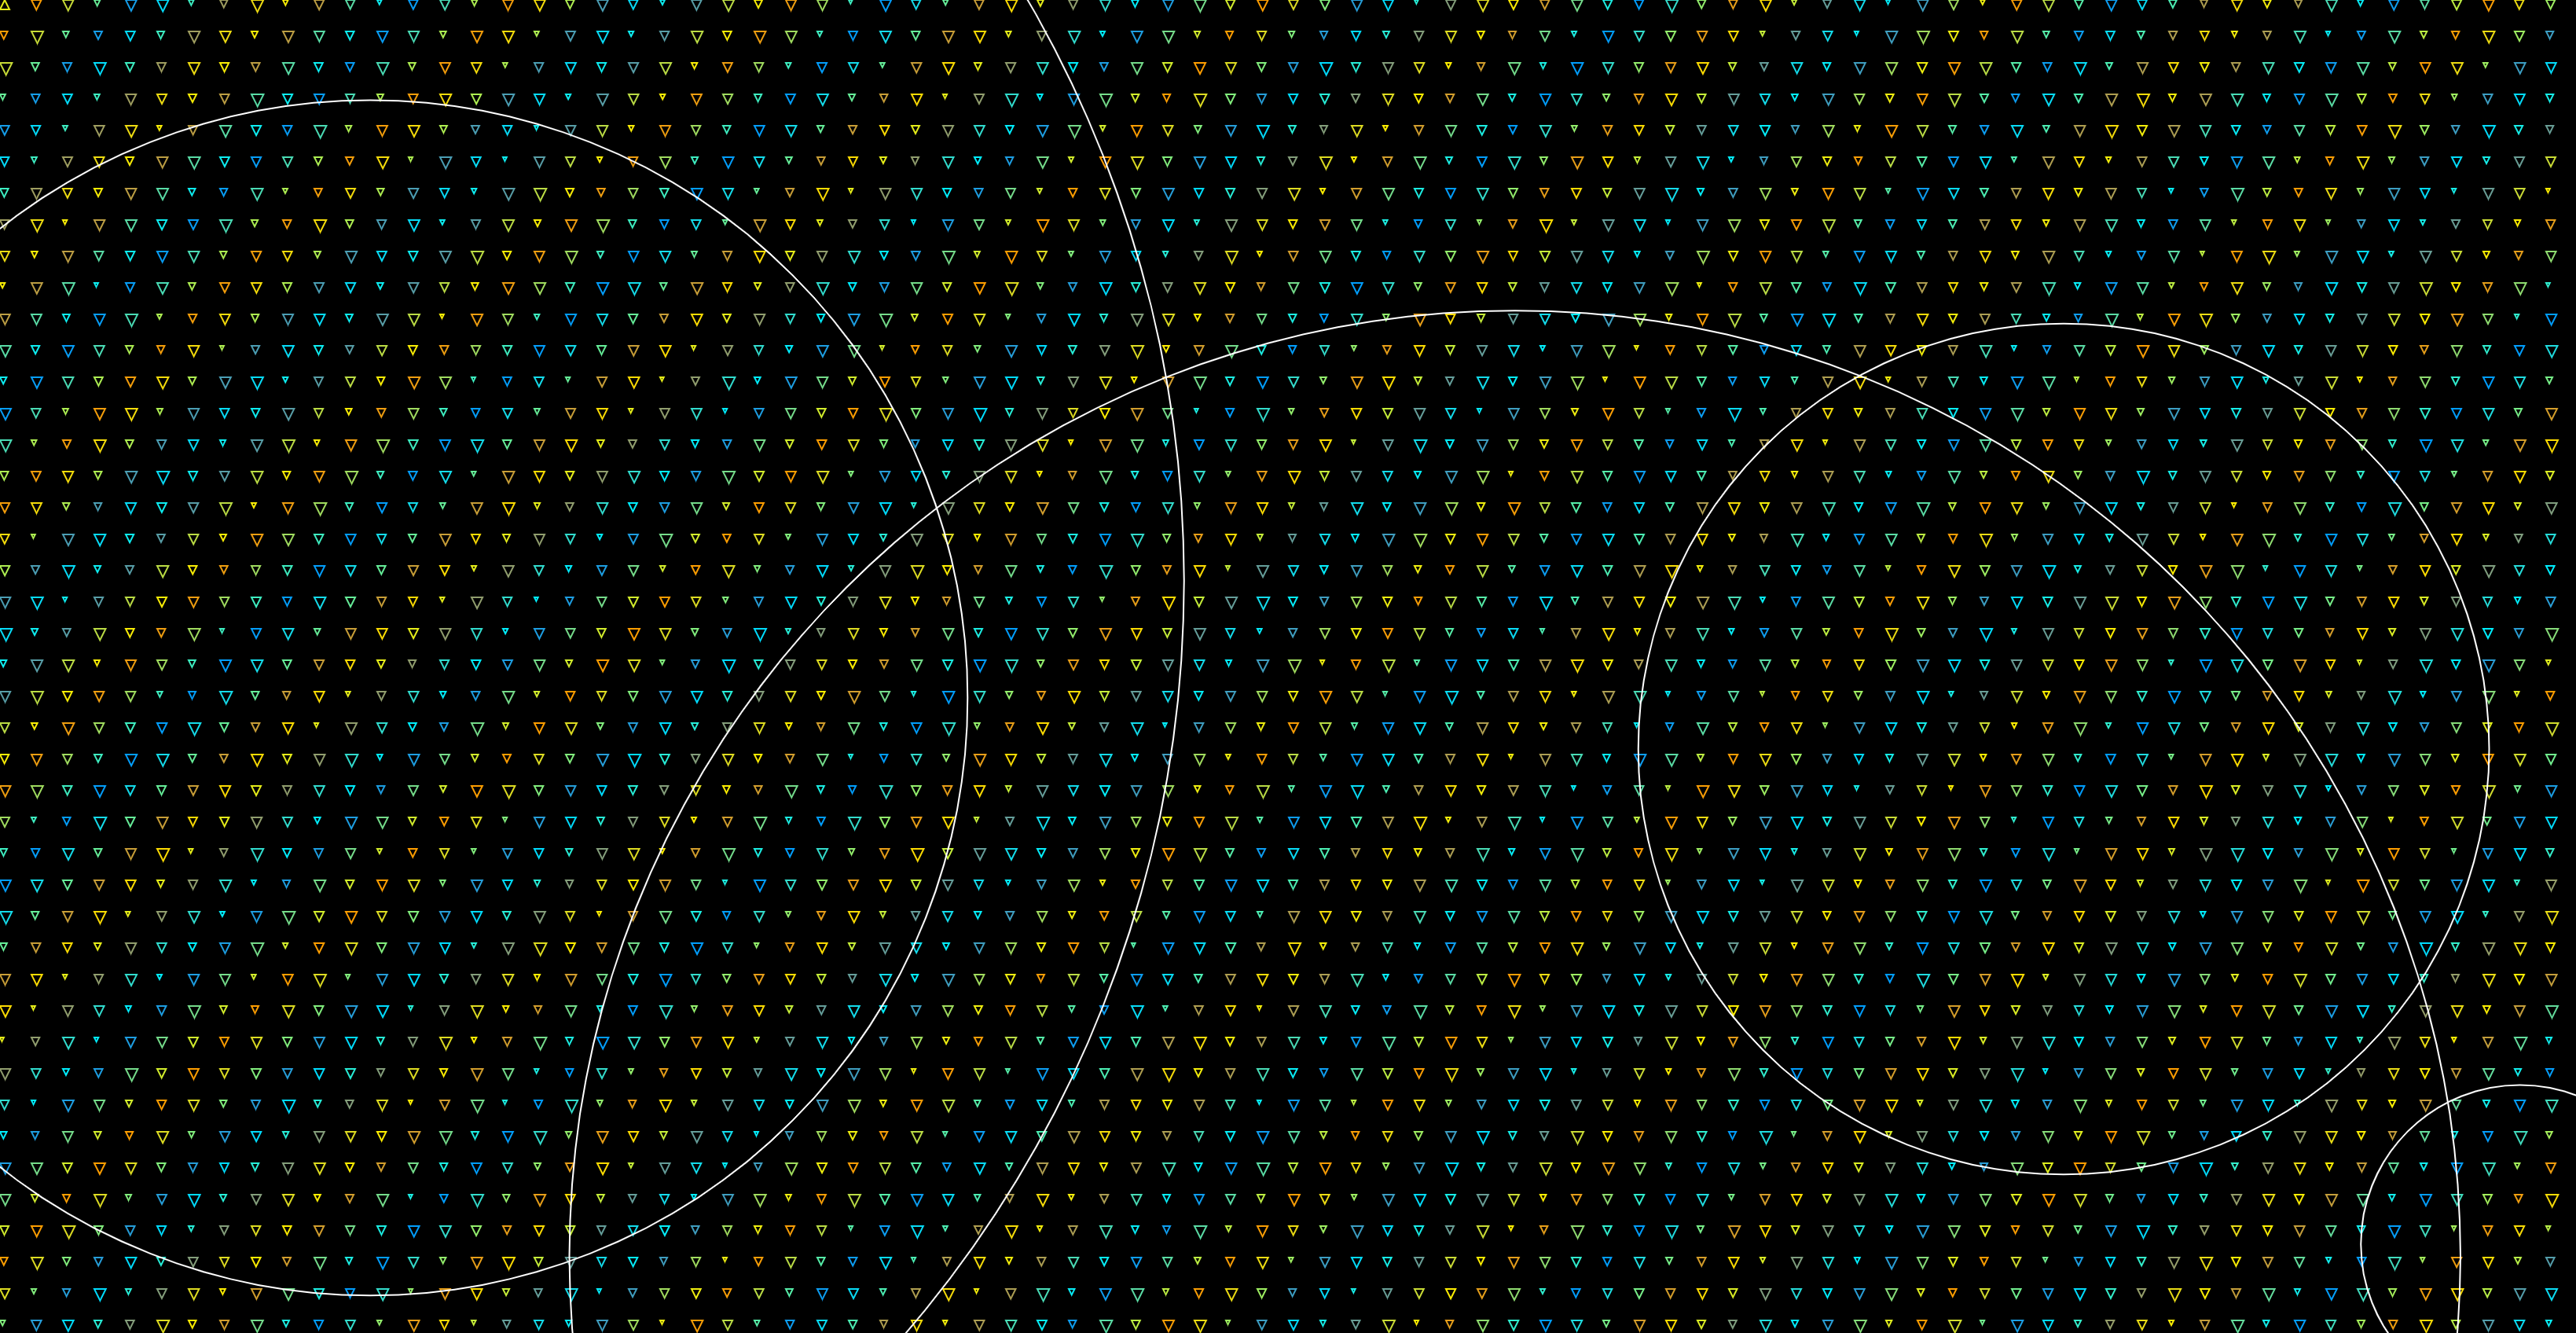
This code uses triangles and Ellipses. The size of the triangle, color changing speed, puddles apperaing is relative to pulse, breath and blink data.
—
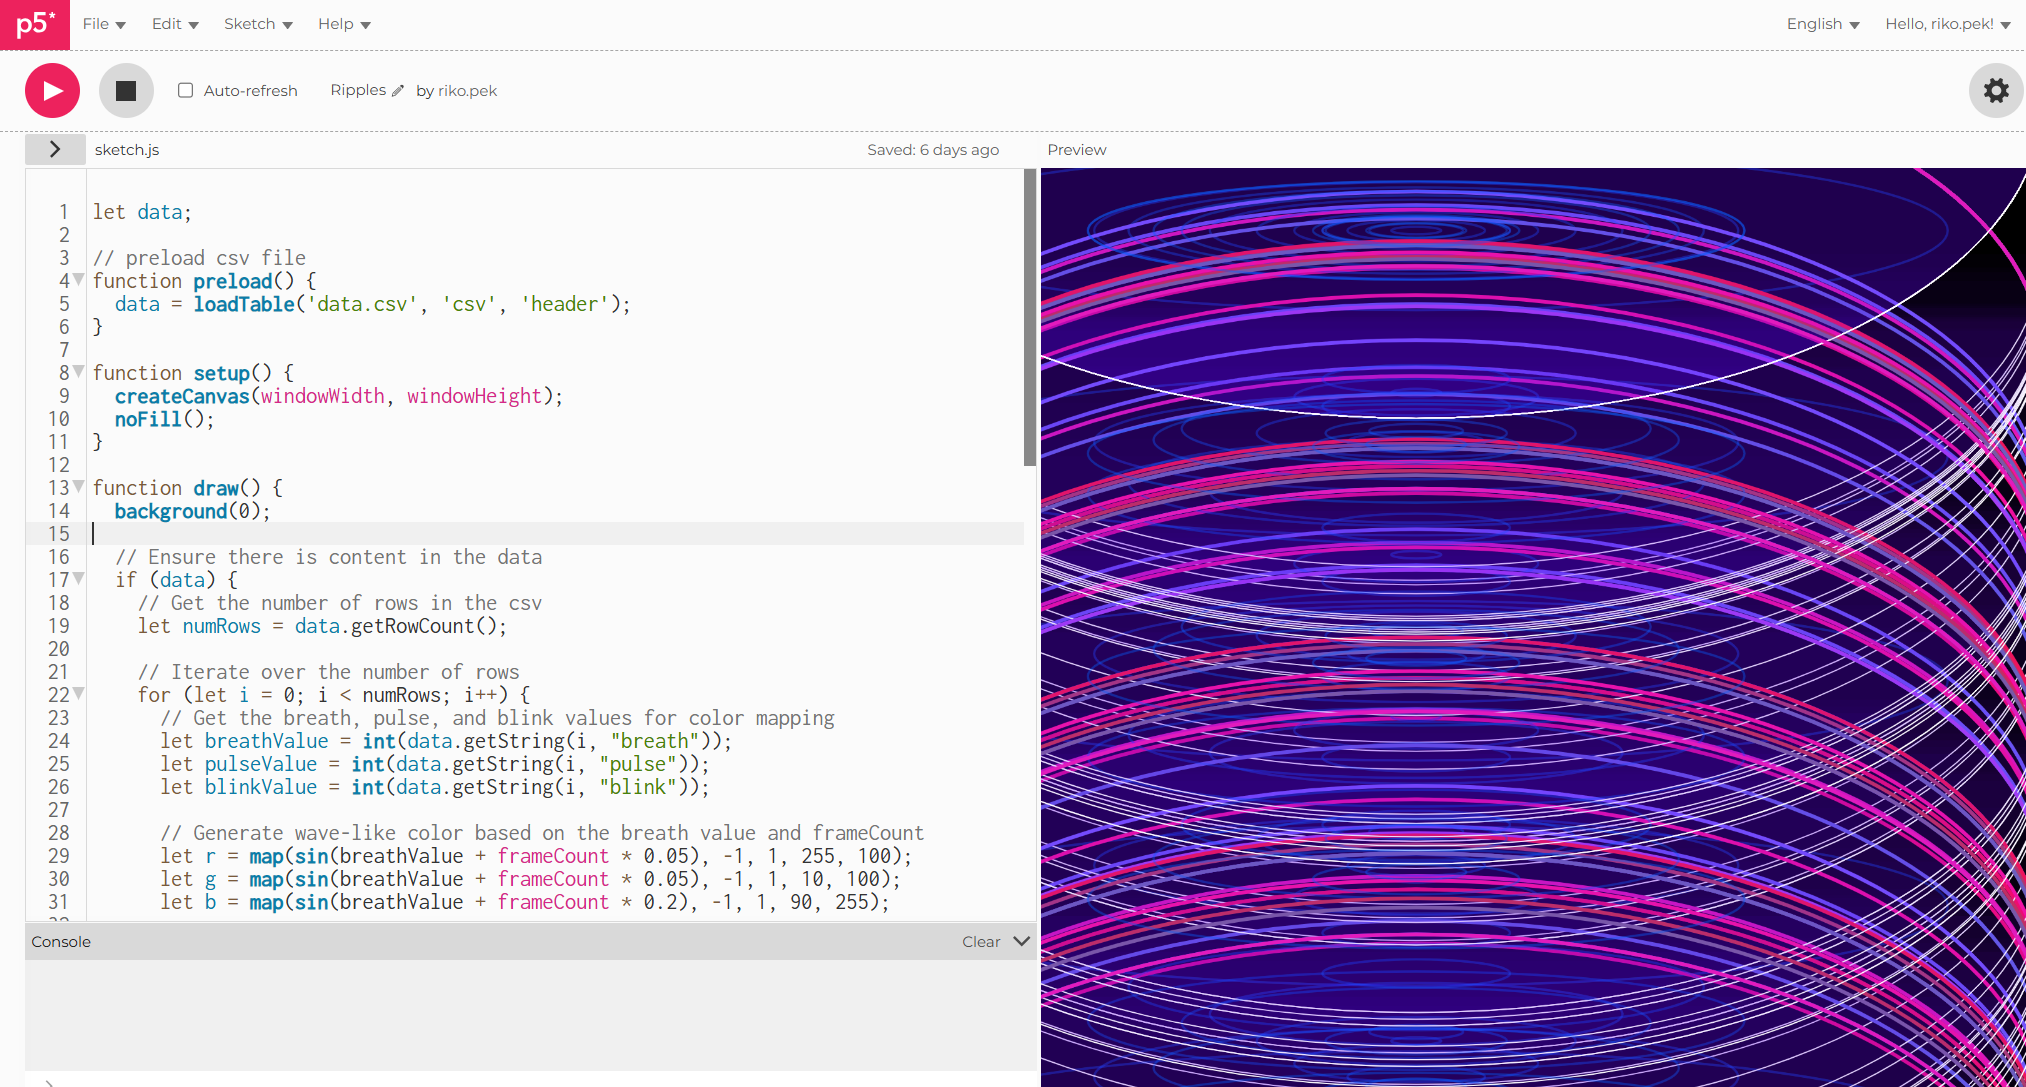
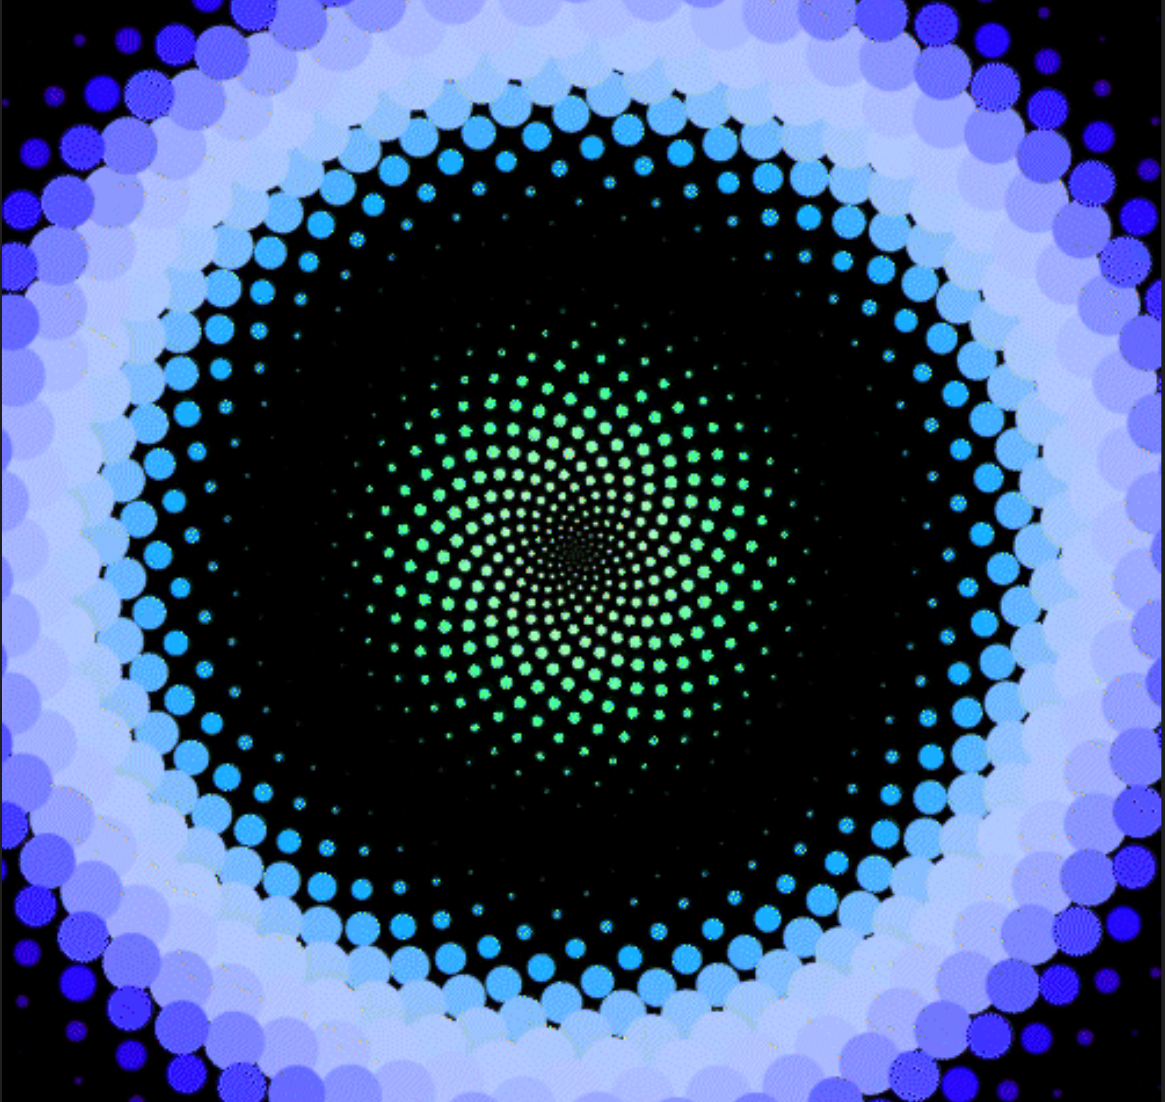
Crafting a more immersive visual but with the datas seperated.


-
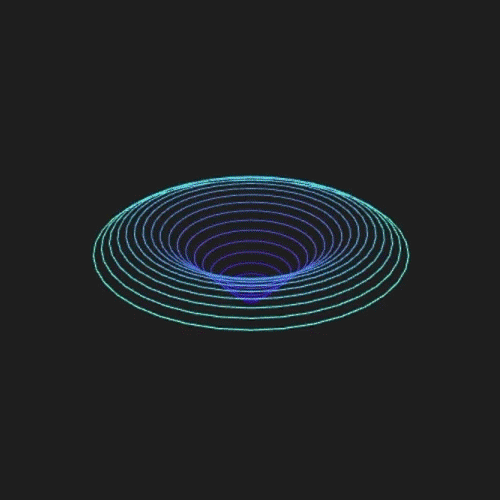
— A Video of how the 3D P5.Js Sketch Moves —
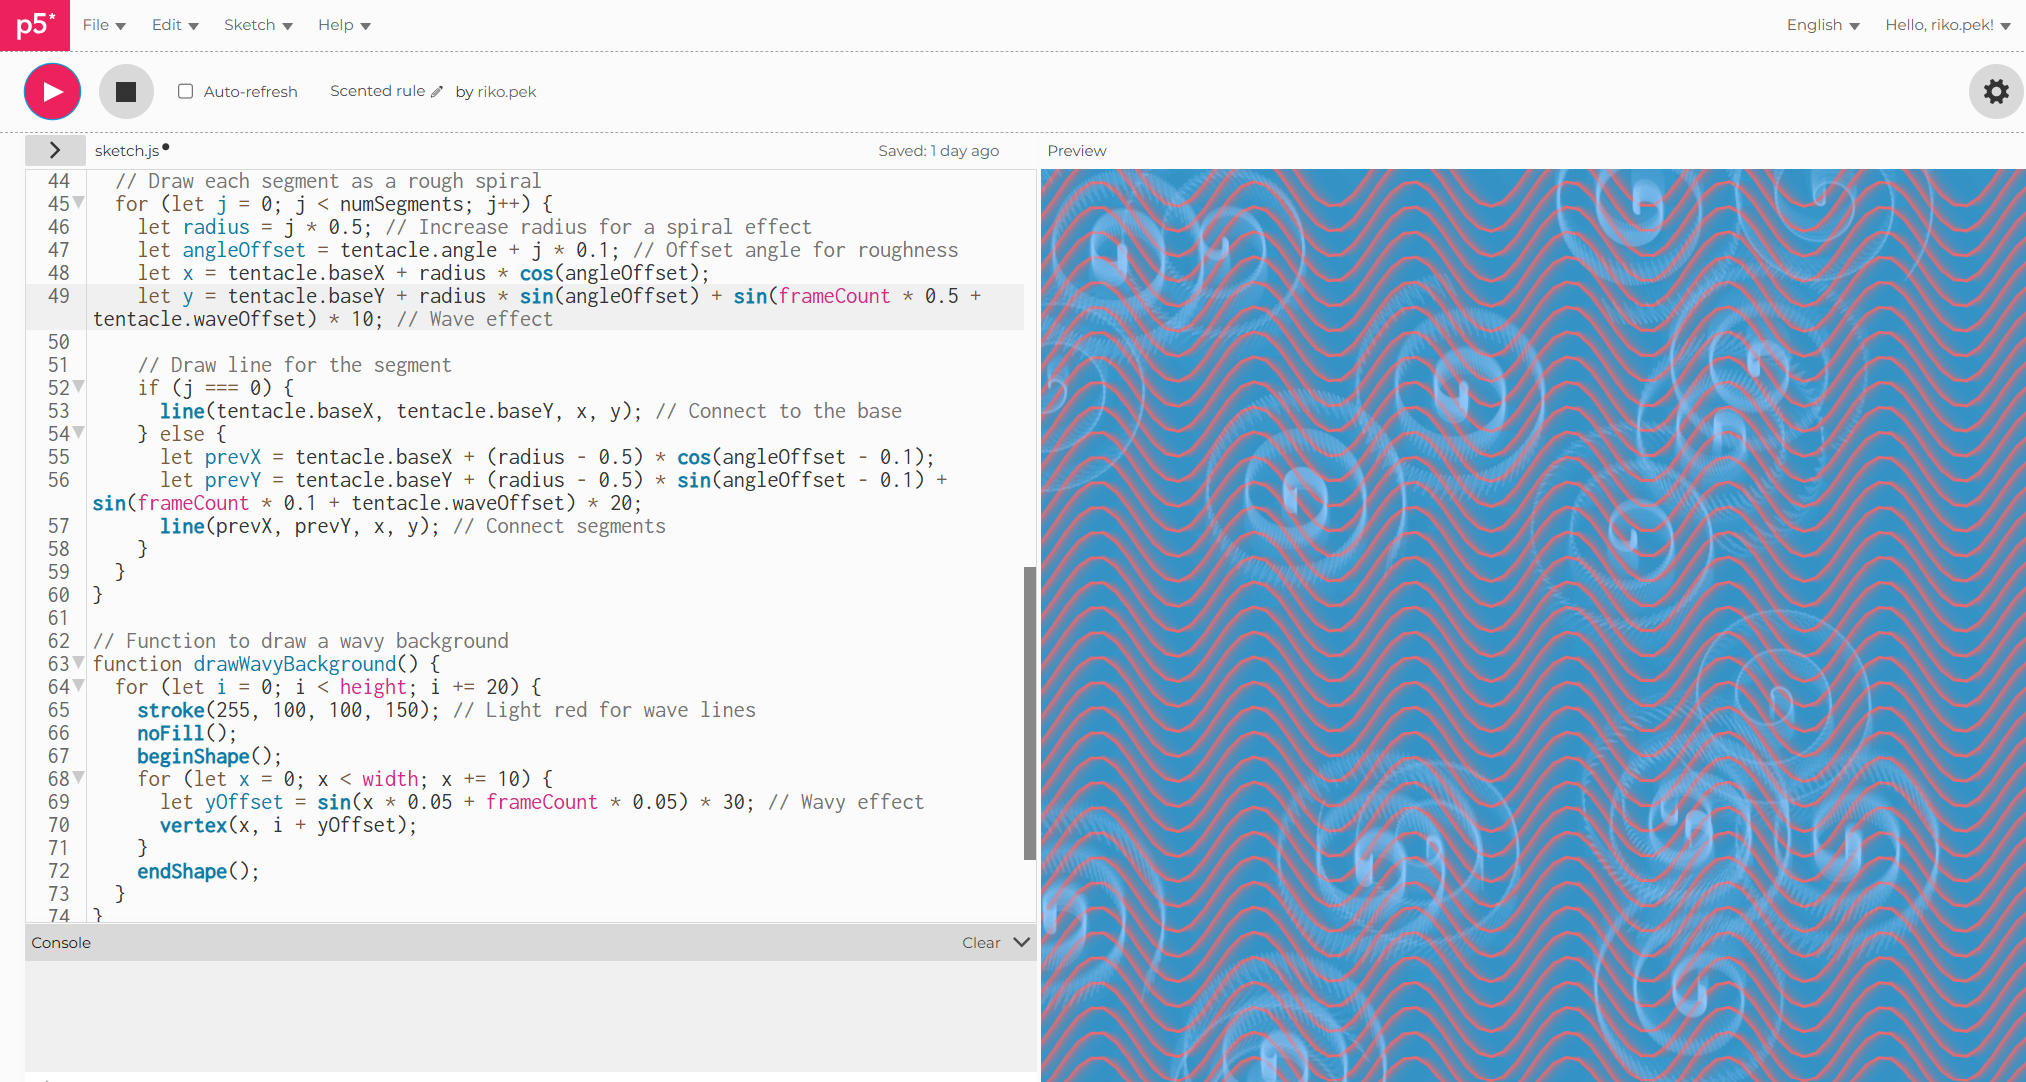
With more confidence with the software, we cerated a more realistic visual consisting of noise function, + blur, + gradient instead of just drawing lines &shape.
—
"Conquering our first steps in coding, we embrace how p5.js empowers us to craft unexpected, intriguing visuals."